Weekly Update for April 7, 2026
The Data
1 detention reported to the PIRC hotline 3/31-4/7 (detention occurred in February)
See below for a review of data from calls to PIRC January-March so far this year! Please note that this is all self reported data, and while likely not a complete picture of all detentions, provides a snapshot in time of what Oregonians have shared they are experiencing.
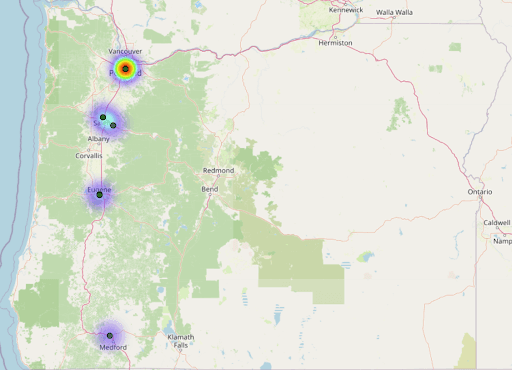
Map of Detentions
Detentions reported to PIRC March 2026: 15 (12 with names)
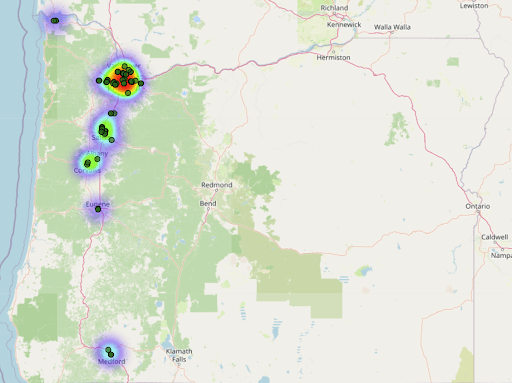
Total detentions reported to PIRC having occurred January-March 2026 (named and unnamed):111

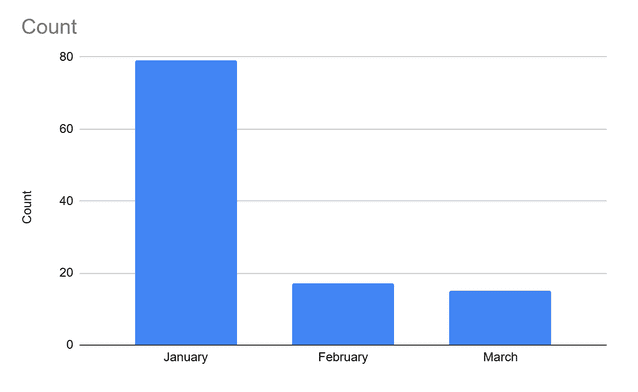
Detentions by month
January:79
February: 16 (10 with names)
March: 15 (12 with names)
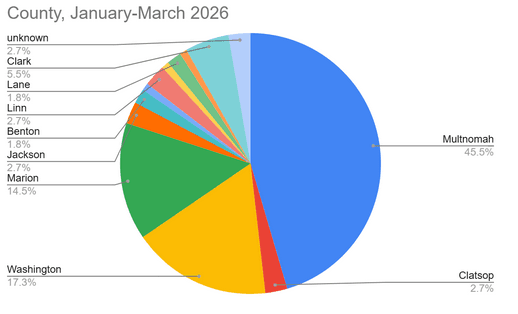
Counties where detentions were reported as occurring
Time of day
Note: an additional 25 detentions occurred at unknown times of day and are not reflected in this graph for easier visibility. Morning and afternoon included in the graph below are at unspecified hours.
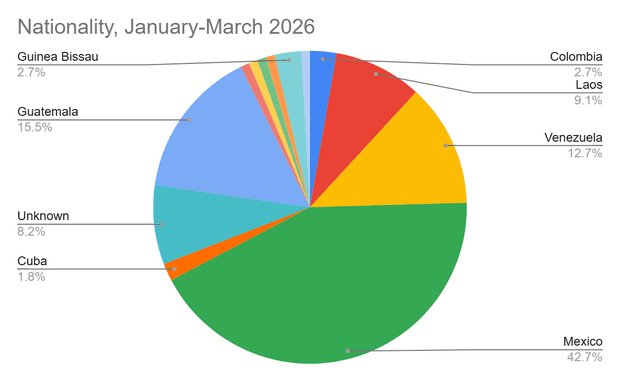
Detentions Jan-Mar 2026 by Nationality
Nationalities most impacted:
Mexico 42.7% (down from 63.7% from July-December 2025)
Guatemala 15.5% ( up from 14.9%)
Venezuela 12.7% (up from 7%)
Largest increase per population: Laos at 9.1% (up from less than .2% )
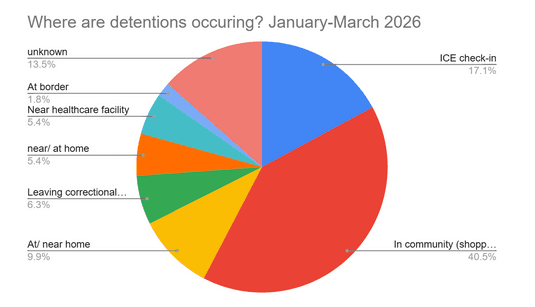
Where detentions are occurring
Note: Descriptions that were truncated in chart say:
In community (shopping, dining, driving, unknown)
Leaving correctional facility, court, or DMV